Graphs: Types, Examples & Functions
Different Types of Graphs
There are eight types of graphs that you will see more often than other types. Each has its own type of function that produces the graphs. They are easy to visually distinguish and by knowing how each looks, you can get an idea of what a graph might look like just by analyzing the function. The eight types are linear, power, quadratic, polynomial, rational, exponential, logarithmic, and sinusoidal.
Linear Graphs
Linear graphs are produced by linear functions of this form:
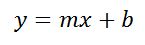 |
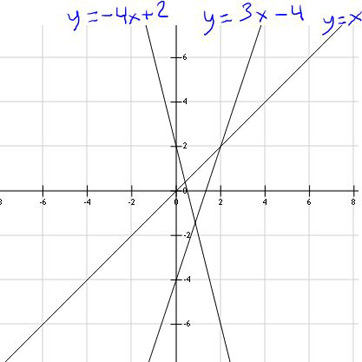
Linear functions have variables to the first degree and have two constants that determine the location of the graph. These functions always graph into a line. The constant m determines whether the line slopes down or up. If it is positive, the line will slope up, and if it is negative, then the line will slope down.
 |
Power Graphs
Power graphs are produced by functions with only one term and a power. The power can be positive, negative, or even a fraction.
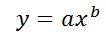 |
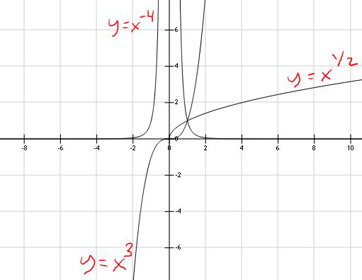
The graphs that these types of functions produce vary depending on the power. If the power is positive, the graph changes direction based on the number of the power. If the power is even, the graph will have both edges going in the same direction. If the power is odd, the graph will have one edge going up and another going down. If the power is negative, it will have two parts. Each part will avoid the x=0 line because that will cause division by zero. When the power is a fraction, the graph goes up at x=0 and then when y is positive, it starts curving towards the x-axis.
 |
Quadratic Graphs
Quadratics are functions where the highest power is two.
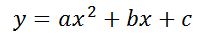 |
They graph into parabolas. The constants a, b, and c determine the location of the parabola on the graph. The a tells you whether the parabola will open up or down. If it’s positive, it will open up and smile. If it’s negative, it will open down and frown.
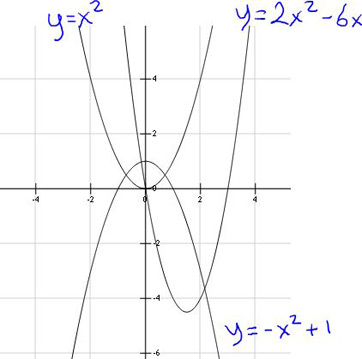 |
Polynomial Graphs
Polynomials are a more general function than a quadratic and allow for higher powers that are still whole numbers.
 |
These functions produce more interesting graphs with more curves. The highest power of the function tells you how many curves or ups and downs the graph may have.
 |
Looking for a Similar Assignment? Order now and Get 10% Discount! Use Coupon Code "Newclient"

