3D Slicer as an Image Computing Platform
Abstract
Quantitative analysis has tremendous but mostly unrealized potential in healthcare to support objective and accurate interpretation of the clinical imaging. In 2008, the National Cancer Institute began building the Quantitative Imaging Network (QIN) initiative with the goal of advancing quantitative imaging in the context of personalized therapy and evaluation of treatment response. Computerized analysis is an important component contributing to reproducibility and efficiency of the quantitative imaging techniques. The success of quantitative imaging is contingent on robust analysis methods and software tools to bring these methods from bench to bedside.
3D Slicer is a free open source software application for medical image computing. As a clinical research tool, 3D Slicer is similar to a radiology workstation that supports versatile visualizations but also provides advanced functionality such as automated segmentation and registration for a variety of application domains. Unlike a typical radiology workstation, 3D Slicer is free and is not tied to specific hardware. As a programming platform, 3D Slicer facilitates translation and evaluation of the new quantitative methods by allowing the biomedical researcher to focus on the implementation of the algorithm, and providing abstractions for the common tasks of data communication, visualization and user interface development. Compared to other tools that provide aspects of this functionality, 3D Slicer is fully open source and can be readily extended and redistributed. In addition, 3D Slicer is designed to facilitate the development of new functionality in the form of 3D Slicer extensions.
In this paper, we present an overview of 3D Slicer as a platform for prototyping, development and evaluation of image analysis tools for clinical research applications. To illustrate the utility of the platform in the scope of QIN, we discuss several use cases of 3D Slicer by the existing QIN teams, and we elaborate on the future directions that can further facilitate development and validation of imaging biomarkers using 3D Slicer.
Introduction
Cancer is the leading cause of death in the developed world, and the second leading cause of death in the developing countries. With the incidence of cancer rapidly increasing, there is an immediate need for better understanding of this disease and for the development of the targeted, personalized treatment approaches. Successful translation of such treatments from the lab to the clinic is contingent on the availability of biomarkers – objective and testable characteristics indicative of normal or pathologic processes that ideally should allow for quantitative measurement of the response to therapy. In this regard, in vivo imaging biomarkers are particularly promising, as they can be highly specific and minimally invasive, providing both anatomical and functional understanding of the response patterns. However, the potential of quantitative imaging remains largely underutilized. The Response Evaluation Criteria in Solid Tumors (RECIST) — the only imaging based biomarker accepted by the U.S. FDA as a surrogate end point for clinical outcome in therapy — relies primarily on the anatomical imaging of the lesion measured by its largest diameter. Continuous advances in multi-modality 3D imaging technology and analysis, along with improvements in computer science and bioinformatics, create an opportunity for a paradigm shift in quantification of treatment response. To advance the role of imaging as a biomarker of treatment, the National Cancer Institute (NCI) launched the Quantitative Imaging Network (QIN) initiative. The goal of QIN is to form a community of interdisciplinary teams engaged in the development of imaging-based biomarkers and their optimization in the context of clinical trials. Research software platforms are essential in prototyping, development and evaluation of novel algorithmic methods as a mechanism for discovering image-based surrogate endpoints. Such platforms should also support integration of the algorithmic advances into the clinical trial workflows. In this paper, we discuss the capabilities and the utility of 3D Slicer (Slicer), as an enabling research platform for quantitative image computing research.
3D Slicer is a free open source extensible software application for medical image computing and visualization. Slicer emerged as a culmination of several independent projects that focused separately on image visualization, surgical navigation and graphical user interface (GUI). David Gering presented the initial prototype of the Slicer software in his MIT Master’s thesis in 1999, based on the earlier experience of the research groups at MIT and Surgical Planning Lab (SPL). Subsequently, Steve Pieper assumed the role of the Chief Architect, commencing the work of transforming 3D Slicer into an industrial-strength package. Since 1999 Slicer has been under continuous development at the SPL under the leadership of Ron Kikinis. Today it is developed mostly by professional engineers in close collaboration with algorithm developers and application domain scientists, with the participation of Isomics Inc., Kitware Inc. and GE Global Research, and with significant contributions from the growing Slicer community. Initially envisioned as a neurosurgical guidance, visualization and analysis system, over the last decade Slicer has evolved into an integrated platform that has been applied in a variety of clinical and pre-clinical research applications, as well as for the analysis of non-medical images. Improvement and maintenance of the software have been possible primarily through the support from the National Institutes of Health (NIH). At the same time, its development has grown into a community effort, as numerous groups and individual users not funded directly to develop 3D Slicer are continuously improving it by reporting software problems and contributing solutions, suggesting new features and developing new tools. As described more fully below, Slicer integrates a number of powerful open source projects into an end-user application suitable for clinical researchers.
The breadth of functionality, extensibility, portability across platforms and non-restrictive software license are some of the main features that differentiate Slicer from the commercial and open source software tools and workstations that aim to cover similar aspects of functionality. Numerous choices of radiology workstations and image analysis tools are available from the commercial vendors. Some of the popular tools used in the clinic as well as in research are AW Workstation (GE Healthcare), syngo.via (Siemens), PMOD (PMOD Technologies Ltd, Zurich, Switzerland), Definiens (Definiens Inc., Parsippany, NJ), MimVista (MIM Software Inc., Cleveland, OH). These packages provide users with a set of analysis tools (some of which may be specifically approved by the FDA for certain clinical tasks), compatibility with the clinical PACS systems and customer support. Such clinically oriented systems are not always affordable by the academic researchers. Commercial solutions are typically not extensible by the end user, are not oriented towards prototyping of the new tools, and may require specialized hardware, limiting their applicability in projects that involve development of new image analysis methods. In the research domain, MATLAB (Mathworks, Natick, MA) has traditionally been the “swiss army knife” of scientific computing. Many researchers use MATLAB for initial prototyping and experimentation, while some end user tools, such as SPM, are built on top of MATLAB. Being a generic prototyping tool, MATLAB is not designed for medical applications and thus lacks support for interface and display conventions common in clinical environments. As a result, deployment of the developed tools for the use by clinical researchers requires translation of the code into more generic languages to minimize dependencies and simplify integration.
As opposed to the commercial workstations, 3D Slicer is meant to provide a research platform that is freely available and does not require specialized equipment. Slicer’s use is not constrained to a single processing task or research application. Its generality and extensibility separates Slicer from such task-oriented packages as ITK-Snap (image segmentation); DtiStudio (diffusion tensor analysis); FreeSurfer1, FSL and SPM (neuroimaging applications). Several other tools, such as OsiriX, BioImage Suite2, MIPAV and ImageJ3, are similar to Slicer in that they provide extensible development platforms for biomedical imaging applications (for a comprehensive comparison of these tools we refer the reader to the earlier surveys ). ImageJ is an extensible Java-based image processing platform that has been applied to a variety of applications, including radiological image processing, with the focus on two-dimensional analysis. MIPAV is a cross-platform Java-based package supported by NIH. OsiriX is an open-source Picture Archiving and Communication System (PACS) workstation and DICOM viewer for Mac OS X that provides advanced capabilities such as image fusion, volume rendering and image annotation, and is extensible via a documented plugin mechanism. ClearCanvas is a Windows-based DICOM workstation adopted by the caBIG project4. The TCGA version of ClearCanvas workstation supports AIM model annotation capabilities, and is also extensible. A notable aspect of both OsiriX and ClearCanvas is that these systems are made available either in a free open source version or as commercial, FDA-cleared products. A practical shortcoming is their dependency on specific operating systems (Mac OS X for OsiriX, and MS Windows for ClearCanvas). Perhaps more importantly some of the aforementioned packages that are similar in their intended purpose to 3D Slicer (including BioImage Suite, MIPAV, OsiriX and ClearCanvas) are distributed under restrictive open source licenses that limit the ability of outside developers to redistribute parts of those systems, in particular in commercial or other “closed source” scenarios. This can be a practical constraint for QIN investigators collaborating with industry partners, as the solutions developed on top of these packages cannot be directly incorporated into commercial products. Another consideration is that critical functionality to work with modern imaging scenarios may only be available in the commercial version of the package. OsiriX and ClearCanvas, for example, do not support 64-bit processing architectures in their royalty-free versions and this limits the maximum size of the image data the software can accept.
3D Slicer does not have any components specific to a particular operating system. Binary distributions are available for 32- or 64-bit versions of Windows, Mac OS X or Linux, and the software can be compiled on other systems, such as Oracle’s Solaris. It is distributed under a BSD-style license agreement allowing free distribution of derivative software for academic and commercial use. Hence, image analysis tools developed within 3D Slicer can be adopted directly by the industry collaborators. Since new technologies can only become part of routine clinical care through their incorporation into FDA regulated medical products, Slicer’s permissive software license furthers the overall goal of lowering the barriers for translation of the successful research solutions into medical products. On the other hand, Slicer is not an FDA-approved device and its license makes no claims about the clinical applicability of the software. It is the sole responsibility of the user to comply with appropriate safety and ethics guidelines, and any products incorporating Slicer technology must be fully tested to comply with applicable laws and regulations. Under these considerations, Slicer has been applied in a variety of projects under appropriate research oversight. In this manuscript, we aim to introduce the capabilities of 3D Slicer as a software platform for clinical imaging research, and outline its use in the context of biomarker development for cancer treatment by several QIN sites.
In the remainder of this paper, we first present an overview of 3D Slicer by discussing its architecture, main features and guiding development principles. Next we focus on the capabilities of 3D Slicer viewed from the perspective of the clinical researcher. We follow with the overview of the 3D Slicer platform from the standpoint of a biomedical engineer, and discuss how Slicer can facilitate development of new software tools for clinical research. To demonstrate how 3D Slicer is currently used by some of the existing teams of QIN, we discuss the clinical research projects investigated at Brigham and Women’s Hospital (BWH) (PI Fiona Fennessy), University of Iowa (PI John Buatti) and Massachusetts General Hospital (MGH) (PI Bruce Rosen). We conclude with the summary of our findings, discussing some of the features and functionalities that would further improve applicability of 3D Slicer to biomarker development by the QIN investigators.
Overview of 3D Slicer
Computerized image analysis plays an increasing role in supporting clinical and research needs. Promising methodologies that may lead to new imaging biomarkers often involve custom image processing software. The role of software evolves over the different stages of the imaging biomarker lifecycle. In the inception stage, promising methodological concepts are identified and translated into early prototypes. Such early prototypes are often cobbled together from parts of tools designed for other tasks. They are typically suitable for use by engineers, for small pilot or phantom studies. Their purpose is to demonstrate that the task can be done. The next step is to demonstrate that the task is worth doing. For this to happen, the method has to be optimized and thoroughly validated outside the research lab. This step requires a software tool that can be used reliably by trained clinical researchers, and can be applied to a larger population of patients, possibly in a multi-site clinical trial. At this point, the software must be robust and the interface intuitive. After establishing the value of a tool, the next step is to translate the software and the biomarker into a clinical, FDA approved product.
One of the goals of 3D Slicer is to provide a common set of base functionality to facilitate development and validation of the medical image computing methods for the “can it be done?” and “is it worth doing?” steps of the imaging biomarker lifecycle. Understanding of the imaging data by visualizing its different aspects, applying basic processing steps, and displaying analysis results in context is critical at the initial stages. 3D Slicer is a powerful visualization tool that allows exploration of the imaging datasets in two, three and four dimensions. Slicer enables fusion of functional and anatomical data, and provides a variety of generic and specialized tools for their processing and multimodal analysis. To ensure robustness, it is often required that image processing methods are initialized manually. The 3D Slicer framework includes the components needed to meet such development needs (e.g., “seed” the image segmentation algorithm, provide initial pose for image registration, or “steer” the processing based on the dynamically updated computation result).
The use of an image analysis tool in a clinical research environment introduces new requirements. Support of the DICOM standard for communicating image data is commonly required, as is a graphical user interface that is usable by a non-technical operator. Slicer allows loading images in DICOM format from disk or directly from PACS. The Qt toolkit5 provides a cross-platform GUI front-end to Slicer that allows each processing module to easily define custom user interfaces. Image analysis tools implemented as Slicer processing modules can be developed in such a way that both interactive and batch execution is possible. This is particularly valuable in situations when experiments have to be performed on a large number of cases, or when certain parameters of the algorithm have to be optimized.
Once a method is optimized and validated, it can potentially be developed into an FDA-cleared clinical device. At this stage, it can be important that the implementation that was developed in the earlier stages can be used without the need to re-implement the key components. Slicer adopts a licensing model that does not place any restrictions on the use of its source code in the derivative works. This aims to broaden the user community to include both academic and industry partners and to simplify the transitioning of the research tool into a commercial product.
The architecture of 3D Slicer follows a modular and layered approach, as shown in Fig. 1. At the lower level of the architecture are the fundamental libraries provided by the operating system that are not packaged with Slicer, such as OpenGL and hardware drivers that allow efficient usage of the windowing and graphics resources of the host system. At the level above, there are languages (primarily C++ and Python, but increasingly JavaScript) and libraries that provide higher level functionality and abstractions. Some of the libraries used by the application are Qt (cross-platform GUI framework), the DICOM Toolkit (DCMTK)6 (implements parts of DICOM standard and is used to interact with DICOM data and DICOM services) and jqPlot7 (provides charting capabilities). All of the external dependencies of 3D Slicer are cross-platform portable and are distributed under licenses fully compatible with Slicer, which do not restrict their use in either commercial or open source products.
Figure 1.
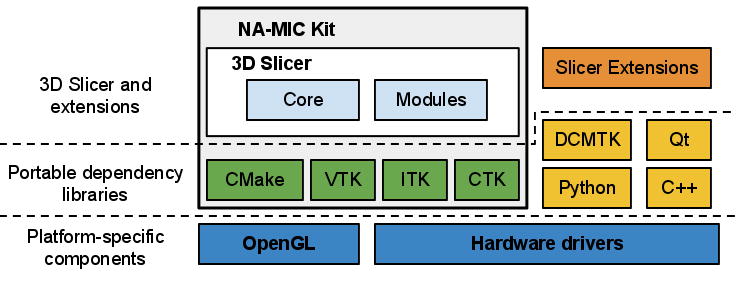
Some of the libraries contributing to the foundation of 3D Slicer are designed in close collaboration and often share the same developer community. These libraries are distributed as part of the NA-MIC Kit, a collection of the software tools supported in part by the National Alliance for Medical Image Computing (NA-MIC) project. The tools and interfaces provided by the NA-MIC Kit components are largely focused on the needs of the developers of medical image computing applications. CMake8 enables cross-platform build system configuration, packaging and testing of 3D Slicer and NA-MIC Kit libraries. CDash9 is a web-based server that organizes the results of software testing. The Visualization Toolkit (VTK)10 provides the key building blocks for 3D computer graphics and visualization. The Insight Toolkit (ITK)11 is a library developed specifically for the tasks related to medical image registration and segmentation, and for implementing new image analysis algorithms. The Common Toolkit (CTK)12 is a biomedical image computing library with the focus on application-level DICOM support, plugin framework and specialized GUI widgets.
3D Slicer itself consists of the lean application core, Slicer Modules, and Slicer Extensions. The core implements the Slicer user interface, provides support for data input/output (IO), visualization and developer interfaces that support extension of the application with new plugins. Internally, Slicer uses a scene data structure to organize images, coordinate frames, annotations, and maintain the application state. The XML-based Medical Reality Markup Language (MRML) is used to serialize the content of the scene. Slicer modules are the plugins that depend on the Slicer core to implement new functionality. Individual modules can be independent, or can rely on other modules (for example, a module that provides lesion segmentation functionality can depend on the volume rendering module to enable 3D visualization of the anatomy and segmented structure). Unlike Slicer modules that are packaged as part of Slicer distribution, Slicer extensions are external plugins installed “on demand” by the user, akin to the web browser extensions. The extensions mechanism enables sharing of the Slicer-based tools that cannot be included into the package due to incompatible licenses, development timelines, or other constraints. It also provides a “pathway” for integrating new functionality, since any extension that satisfies specific requirements is a candidate to be included into the Slicer distribution. The requirements for integration to the distribution include the following: a designated maintainer to serve as a point of contact, a non-restrictive Slicer-compliant license, adherence to the Slicer coding standards, availability of software tests and appropriate user-level documentation. We emphasize that tools that do not satisfy these requirements can still be available to Slicer users, clearly marked as Slicer extensions and accompanied by an appropriate disclaimer.
Since its inception in late 1990s, 3D Slicer has been evolving with major architectural, functional and GUI redesigns occurring every 4–5 years. The current (fourth) generation of Slicer was released in November 2011. The most notable improvements of the software as compared to the previous (third) version are improved visualization performance, re-engineered DICOM support, completely redesigned GUI and availability of the Python development interfaces. With each major redesign, several policies are followed to ease the transitioning of users and developers to the updated platform. The base and core modules are released to the broader development community first, followed by the migration of the specialized modules. For example, the migration strategy for the modules in the image-guided therapy (IGT) category is the most conservative due to the mission-critical nature of these applications. As such, the modules in this category are usually migrated after the base of the new release is stable and thoroughly tested. Another policy has been to provide backward compatibility to support reading of data produced using the earlier version.
Within each generation, new and updated releases of Slicer are prepared every 2 to 6 months. These releases include performance improvements, bug fixes and new functionality, but no major changes to the base architecture or GUI. A release includes a tagged version of the source code in the source code repository as well as binary installation packages for the supported platforms (Windows, Mac OS X, Linux; 32-bit, 64-bit). Daily binary installation packages are also prepared for the major platforms to track the current version of the source code. These daily packages allow Slicer users to access the new functionality under development. The Slicer software development process is collaborative and geographically distributed, with over 80 authorized developers contributing source code through SVN and Git revision control systems. To ensure the stability of the software, the source code is compiled and tested on a daily basis on a variety of platform configurations. The testing results are summarized and reported using a web-based centralized CDash dashboard. Users and developers of 3D Slicer can also report issues on the open mailing lists or using web-based bug tracking system.
Documentation, training and user support are high priorities for the Slicer community. Hands-on training sessions are organized regularly as part of on-going outreach initiatives at major conferences, such as the annual RSNA, MICCAI and SPIE meetings, or in response to request by host institutions at both national and international venues. Semiannual hands-on week-long project weeks are open for participation to anyone interested in developing or using Slicer tools, and are an ideal place to exchange ideas and experience. Remote learning of 3D Slicer is supported by the online resources and community mailing lists. Focused training materials that include sample datasets and step-by-step instructions are available for basic Slicer operation as well as advanced workflows. Wiki-based web pages accompany every module of the 3D Slicer providing reference documentation of functionality and usage examples. User and developer community mailing lists have been active for the last 10 years, and currently include over 770 and 440 subscribers, respectively, providing a source of Slicer expertise extending well beyond the community of the core Slicer developers. Around 2,800 messages were exchanged on these Slicer mailing lists in 2011.
There are two major communities of Slicer users. First, there are medically-trained researchers that apply the tools available in the 3D Slicer to novel clinical applications. Second, there are biomedical engineers and computer scientists that use 3D Slicer as a platform for development and delivery of their algorithmic work. In the next two sections, we discuss the main capabilities provided by 3D Slicer from the standpoint of scientists who are members of those two communities.
Clinical Research Platform
From the perspective of a clinical researcher, Slicer is an advanced image visualization and analysis workstation, and it shares a lot of generic functionality with the commercially available packages. Unlike most of the commercially available workstations, 3D Slicer is not an FDA-cleared product, and its intended use is clinical research applications. In this sense, Slicer is very different from its commercial counterparts, since it incorporates experimental tools that cannot be packaged within the workstations used clinically.
3D Slicer is available in the form of binary packages that have platform-specific installers for all major operating systems. These packages are self-contained, which means they include all the dependency libraries and toolkits needed to use Slicer on a given platform. This also makes it possible to run two or more versions of Slicer at the same time, since the packages do not share any components. Slicer includes core functionality that covers common needs for a variety of applications as well as task-specific modules. The main application GUI provides a consistent interface for the software, simplifying the learning process, since all modules follow the same conventions and share the same set of GUI controls. The two major components of Slicer GUI are the layout-controlled data viewers and the module GUI panel, as shown in Fig. 2.
Figure 2.

Visualization elements and capabilities
3D Slicer visualization capabilities support various imaging modalities (e.g., CT, PET, MRI and Ultrasound) and can be used for visualization of 2-, 3- and 4-dimensional datasets. Support of 3-dimensional datasets (MRI, CT, PET) has enjoyed most attention based on the substantial number of use cases and resulting in a large number of tools developed specifically for this kind of data. Although support of the newer and less commonly applied 2- and 4-dimensional modalities is possible, it is a fertile ground for the future development. Data visualization in Slicer is enabled by the 2D and 3D viewers. The 2D viewers allow visualization of cross-sections from 3D or 4D image volumes, and support the associated image operations such as: basic image manipulations (zoom, window/level, pan), multiplanar reformat, crosshairs and synchronous pan/scroll for the linked viewers. Advanced capabilities of 2D viewers enable display of various types of glyphs for visualization of tensors and vector fields. Lookup tables (LUTs) support the mapping between the image values and the colors displayed in 2D viewers (e.g., grayscale LUT is typical for CT images, but color can be preferred for PET). Each 2D viewer supports three image “layers”: the user can select “background” and “foreground” image volumes as well as a “label” image volume (which can represent segmentations), and fuse the three layers by adjusting transparency. 2D viewers also support a “Lightbox” mode, where multiple slices from a volume are tiled within the viewer. The 3D viewers enable visualization of volume data, such as triangulated surface models, fiber tracks, glyphs and volume renderings. Augmented reality applications can utilize stereoscopic capabilities of the 3D viewers. Two- and three-dimensional elements can be combined in the 3D viewers to provide an integrated visualization of the various data to the end user, as shown in various figures throughout this manuscript. Coherent integration and visualization of multiple images and data types in 2D and 3D viewers is achieved via a common, scanner-independent, patient-centered physical space coordinate frame reference system. Spatial alignment of individual volumes can be achieved by introducing hierarchies of rigid and deformable spatial transformations. These transformations can be defined manually by the operator, or using the automated registration tools. Finally, chart viewers, a relatively new feature under development, are available for displaying plots.
A variety of image markup and annotations are supported. Following the convention used by Rubin et al., we use the term image markup to refer to the graphical elements overlay, and image annotation for the text-based information, both of which describe a certain finding in a given image. The markup elements provided by the 3D Slicer (as of writing this) are fiducials (points), uni-dimensional measurements (rulers), 3D box ROIs and 3D image raster ROIs (“label maps”). It is important to note that all of the markup elements, with the exception of label maps, are defined in the 3D coordinate system of Slicer as opposed to the voxel coordinates of the image slice. Label maps store image segmentations that define how individual voxels of the image map to certain classes (specific anatomies or pathologies). As such, label maps are defined in the image space. Currently, each voxel can belong to only one segmentation class, although an arbitrary number of label maps can be created for a given image volume. Annotations can be associated with each markup element as free text.
Layouts allow customization of the number, type and configuration of the viewers to suit a specific use case. The user can choose from the set of pre-configured layouts. Layout configuration and content can also be manipulated by the Slicer modules. This capability is similar to DICOM hanging protocols, although layouts tend to be selected and populated with content manually. Since layouts are stored in the Slicer scene-graph, they can be serialized and restored, complete with their content, from session to session. Of specific interest to the QIN community, are the Slicer layouts referred to as “Compare” and “Quantitative”. The Compare layouts allow exploration of longitudinal or multi-modality image sequences by placing each volume in a separate viewer and coordinating the display such that corresponding anatomy is displayed across all the viewers. Quantitative layouts include chart viewers side by side with the 2D and/or 3D viewers.
Modules
Slicer follows a modular paradigm in delivering task-specific functionality to the user. Each module is a feature-complete functional unit designed to serve a specific task. A variety of modules designed for different research applications are included in the distribution of the software. The modules are grouped according to the functionality they provide. The active module can be selected by the operator using the Slicer main GUI, which will expose the controls of the selected module in the Module GUI panel (e.g., see Fig. 2). A formatted web-based wiki page that describes its functionality, use-cases, GUI controls and includes references to academic publications accompanies each module. We note that virtually all of the processing done by the individual modules in Slicer is in the context of 3D volumetric data. As a side-effect of this, generic Slicer tools may not be well suited for processing non-volumetric data such as endoscopic video, free hand ultrasound, or conventional radiographs, although customized Slicer-based tools for some of these tasks have been developed.
Core modules of Slicer are those that support functionality applicable to a breadth of applications, such as DICOM IO support (“DICOM” module), volume rendering (“Volume Rendering” module) and the manipulation of spatial transformations for manual registration (“Transforms” module). The other categories of modules include the following:
-
Filtering: tools for pre-processing and auxiliary operations on images. Functionality includes arithmetic operations, Gaussian and anisotropic denoising filters and intensity inhomogeneity bias field correction, among other tools.
-
Registration: rigid and non-rigid spatial alignment of the images. These modules support point-, surface- and intensity-based registration. Individual intensity-based registration modules implement algorithms that vary by the similarity metric used (e.g., mutual information or cross-correlation) and flexibility of the transformation parameterization (e.g., rigid, affine, B-spline and dense deformation fields are supported).
-
Segmentation: tools that separate individual sub-regions in the dataset based on certain features. Most of the tools in this category operate on single- or multi-channel images, although a module for segmentation of triangular surfaces based on curvature is also available. Image-based segmentation tools include both interactive and automated methods. Techniques implemented include region-based statistical methods, level sets, active learning and Expectation-Maximization multi-channel segmentation. The Editor module contains a collection of tools for manual and semi-automatic segmentation.
-
Surface models: tools for creating and manipulating triangulated surface models. Such models can be constructed either from grayscale image volumes, or, more typically, from the segmented label maps.
-
Diffusion: modules designed specifically for processing Diffusion Tensor Imaging (DTI) MRI. This category includes tools for diffusion I/O as well as techniques for denoising, tractography, and clustering of fiber tracts.
-
Image Guided Therapy (IGT): modules that support applications in image-guided therapy. The key functionality provided by the tools in this category is the OpenIGTLink interface that enables exchange of data between Slicer and external systems, such as robotic devices, MR scanners, and commercial image-guided surgery platforms.
The collection of modules is continuously expanding as new functionality is contributed by the community, and the modules are migrated from the previous releases of the software.
Data Formats and Organization
Support of the widely accepted data exchange standards and interfaces are critical for any image computing tool to be useful in a clinical research environment. 3D Slicer supports import, query, retrieve, and storage of clinical images using DICOM protocols and data structures. These features allow data exchange with clinical systems such as scanners, workstations, and PACS servers. Example use cases for DICOM networking include: (1) setting up a scanner to route newly acquired images directly to a DICOM listener in Slicer to support image guided therapy; (2) using Slicer to query and retrieve DICOM studies in a departmental PACS to perform retrospective image analysis; and (3) sending derived (post-processed) images to a PACS system to become part of the patient record. In all cases, coordination with responsible clinical support staff is required to ensure that research use of Slicer is authorized and has been tested to confirm that it will not interfere with ongoing clinical care. Implementation of the import and export of DICOM RT structures user in radiotherapy is currently under way.
As images are imported into Slicer, they are added to the Slicer scene that is used to organize the individual data elements. While the user performs operations on the data or reconfigures the visualization elements of the interface, the scene is used to keep track of the application configuration. Scene views cache the complete state of the Slicer application, including the configuration and content of the viewers, together with a screen capture of the visualization elements and a textual description. Slicer scenes can contain multiple scene views that emphasize or communicate different aspects of data or different stages of its processing. Scenes can be stored on disk using the MRML format for sharing of the analysis results and to facilitate reproducibility of the observation. As an example, a scene view can correspond to a visualization that was used to prepare a certain figure in a report or manuscript. Accompanied by the Slicer scene, version of the software used and input dataset used to prepare it, such an article would provide a detailed provenance record, together with the methods, parameters and visualization context.
In summary, 3D Slicer is a comprehensive application that can be used for various tasks related to both the qualitative and quantitative exploration of the multimodal medical imaging data received directly from the imaging equipment or clinical PACS. The supported tasks include image overlay and fusion; annotation and quantitative measurement of lesion dimensions and volumes; image filtering and preprocessing; automated registration of images and segmentation of the individual structures. The MRML serialization format facilitates reproducibility of the obtained results and their exchange across research groups. However, research applications often have unmet needs that require development of new image analysis tools. In the next section, we explain the basic concepts required for implementing new functionality using Slicer platform.
Research Development Platform
One of the main goals of 3D Slicer is to provide biomedical engineers, developers, and applied scientists with the essential components for quick prototyping and efficient development of biomedical image analysis tools. From the beginning, Slicer has been designed to be open and extensible. As a platform, it establishes the interfaces and design patterns for developing new functionality and integrating the existing components into new tools. New functionality is introduced into Slicer in the form of modules and extensions. The key user-level features of the application, such as DICOM interfaces, versatile visualization mechanisms and processing tools, can also be accessed via the documented application programming interfaces (APIs). This enables reuse of the existing component, thus reducing development time and encouraging creation of consistent user interfaces.
Slicer Core Architecture
The core of Slicer follows object-oriented programming paradigm and is coded using C++ programming language. The APIs of the core classes are also exposed via Python wrapping mechanisms. In the recent years, the Python programming language has become a popular computing tool in the scientific community, in particular due to its broad applicability, relative simplicity and the availability of powerful open source scientific tools and libraries such as SciPy13. Python wrapping of the Slicer functionality makes it possible to develop fully functional scripted modules, thereby allowing quick prototyping and simplifying the development process. Such modules can leverage the existing functionality of both the Slicer application and various Python-based scientific libraries.
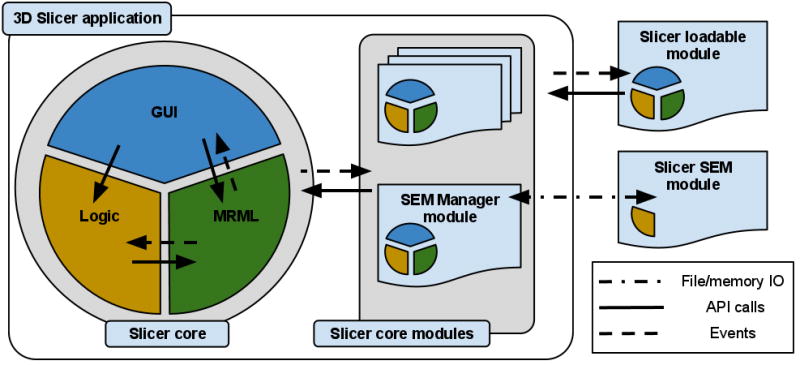
The classes that implement the core of 3D Slicer are organized into three main groups based on the functionality they provide, following the Model View Controller (MVC) design pattern and rely on event communication and API calls for coordination. The main components of the application core are the following, as shown in Fig. 3:
Figure 3.
-
The Model is responsible for data organization and serialization, and is supported by the Medical Reality Markup Language (MRML). MRML defines the hierarchies of the data elements, and the APIs for accessing and serializing the individual nodes. MRML support in the Slicer core is provided by the MRML library, which is a key component of the Slicer architecture, but does not have any dependencies on the other core components. This library is used by the Slicer core and plugins to instantiate the MRML nodes and organize them into a coherent internal data structure called the MRML scene. The MRML scene maintains the links between the individual data items, their visualization and any other persistent state of the application and modules. As an example, a MRML node can store the processing parameters used by the algorithms implemented in the individual modules, or the window/level settings used to visualize a specific image volume.
-
The View maintains the state of the visual elements of the application. The View functionality is provided by the GUI and displayable manager classes of the Slicer core. These classes maintain consistency between the internal MRML state (Model), and the visual appearance of the Qt GUI data viewers of the application (e.g., multiple slice reconstructions can exist, while pointing to the same underlying image data structure). The updates to the GUI and visualization components of Slicer trigger events that propagate via the corresponding GUI classes to the “stateful” MRML nodes. Displayable managers maintain consistent visualization of certain data elements in multiple views/viewers. For example, intersections of the modeled diffusion tracts can be displayed in the 2D slice viewers in an anatomical image overlay and as streamlines in the 3D viewers, both handled by the same displayable manager.
-
The Controller, or Logic component encapsulates the processing/analysis functionality of the application core. The logic does not depend on the existence of GUI, but is fully aware of the MRML data structures. Communication between the view and controller components happens indirectly through changes to the MRML data structures. The logic classes use the MRML nodes for storing the computation results. The view classes can register to receive event updates from the MRML scene and the individual nodes, which in turn initiate updates of the visualization elements.
Modules
The event-driven architecture of the Slicer core is complex in part due to the fact that the application incorporates several libraries (Qt, VTK and MRML) that have their distinctive event handling mechanisms. Recognizing that deep understanding of the application internals has a steep learning curve, Slicer provides two approaches for introducing new functionality as Slicer Execution Model (SEM) plugins or Slicer loadable modules. These approaches differ primarily by the level of their integration with the application core and — as a consequence — by the level of expertise in Slicer internals required from the developer.
The Slicer Execution Model (SEM) implements the simplest approach, as it does not require any knowledge of the 3D Slicer architecture, and does not have dependencies on the Slicer libraries or source code. SEM modules implement the task-specific Controller component of the MVC design, while the View and Model elements are maintained by the main application via the specialized SEM Module Manager (SEM-MM) core module, see Fig. 3. SEM-MM also serves as a communication intermediary between the application core and the SEM modules. The interface for this communication, defining the input/output data (e.g., images, transformations and points) and processing parameters that need to be specified by the application user, is described using XML, based on the Slicer SEM XML schema. This XML description is also used by SEM-MM to populate the GUI elements of the module panel with widgets that control inputs, outputs and the processing parameters.
The SEM XML compliant communication interface is the only requirement imposed on the SEM modules by the Slicer application. SEM modules can be implemented as independent executable files, shared libraries or scripts (such as Python or MATLAB scripts) that via SEM can leverage Slicer visualization and DICOM capabilities. Internally, they can use any of the processing libraries, and do not need to have any dependencies on the components distributed with 3D Slicer. SEM modules can also be distributed in the binary form, which satisfies the needs of developers and communities that cannot share the source code of the module, but are willing to make the tool available to the users. SEM modules are most suited for implementing new functionality that does not require interaction, dynamic visualization and reconfiguration of the Slicer interface. Examples of such modules included in Slicer are image resamplers, filtering and automatic registration tools. Slicer SEM has also been adopted as a mechanism for developing and integrating interoperable tools by several projects independent from Slicer, such as GIMIAS14, BRAINS and NiPype. By supporting the SEM, the aforementioned packages are able to directly incorporate Slicer SEM modules into their framework.
Compared to SEM plugins, Slicer loadable modules have complete access to the Slicer core logic, GUI and MRML elements. Loadable modules are typically developed for interactive tools, or for those applications that require new MRML data types, event handling or customization of the main Slicer GUI. Loadable modules follow the same MVC design pattern as the application core by introducing module-specific Logic, as well as GUI and MRML classes. Logic classes are typically the most important component for the developers of the new image analysis tools, as they include the core computation and the implementation of the analysis algorithms. Such an implementation would usually (although this is not a requirement) rely on the Insight Toolkit and VTK for constructing pipelines and implementing lower level processing steps. The View elements allow the module to interact with the operator to initialize the inputs and processing parameters, and any interactive initialization of the algorithm (e.g., collect the initialization seed points placed in the 2D slice viewer for a lesion segmentation tool). Examples of the interactive loadable modules available in 3D Slicer are “EMSegmenter” that implements expectation maximization multichannel segmentation algorithm and “Tractography fiducial seeding” that allows visualization of reconstructed DTI tracts at a location defined interactively by the user. We emphasize that both SEM plugins and loadable modules can be written in C++ or they can be scripted using the Python language. In our experience, Python scripting can greatly simplify and expedite implementation of the new functionality.
Investigators planning to develop new 3D Slicer functionality should also be aware of its various research interfaces used for data communication. Although support of DICOM is critical for the communication with the clinical systems and equipment, this format is not always suitable for the needs of medical image analysis community since the data fields it stores can contain patient-sensitive information and are often irrelevant for the image processing tasks. Moreover, in several new or emerging applications there is no standard that regulates how certain aspects of data that are critical for its accurate interpretation are stored using DICOM. Or, when standards do exist, they are often not fully implemented or are ignored in their entirety by vendors. As an example, vendor-specific private tags are still commonly used to store acquisition information specific to Diffusion Weighted MRI, even though a DICOM standard format exists. To address these limitations, Slicer uses custom code (in particular, the IO mechanisms provided by ITK), to support several additional formats, such as NRRD15, that are commonly adopted by the image analysis community. These formats often provide a more concise and less ambiguous formatting of the image-specific information. ITK IO is also used to store spatial transformations. Support of 3D models IO, such as surfaces streamlines and polygonal data, is available via VTK and STL formats. Finally, Slicer supports OpenIGTLink network communication interface that has been widely used in the interventional applications to communicate with instrument trackers, imaging and robotic devices.
Having reviewed the functionality and implementation of Slicer, we continue with the specific use cases derived from the experience of the sites participating in QIN. Imaging needs, body organs and clinical problems studied at each these sites are different. Nevertheless, 3D Slicer was identified independently as a platform of choice to support the needs of clinical researchers and biomedical engineers of the respective projects.
QIN Use Cases
BWH
The objective of the Brigham and Women’s Hospital QIN site (PI Fiona Fennessy) is to study MR analysis tools and algorithms for detection of prostate cancer and disease recurrence, and as a guide for targeted prostate therapy. There is increasing evidence that MRI can facilitate the detection and characterization of prostate cancer (PCa) through the use of a combination of multi-parametric MRI (mpMRI) techniques (such as DWI and dynamic contrast-enhanced (DCE) MRI) in addition to the T2-weighted (T2w) MRI, used routinely in the clinic. This functional aspect of MR imaging could contribute greatly to the accuracy of tumor detection and localization, and potentially serve as a guide for focal ablative therapy, or could non-invasively assess functional aspects of prostate tissue microcirculation in response to neoadjuvant treatment. While mpMRI (DWI and DCE MRI in particular) could potentially become imaging biomarkers of PCa, thorough evaluation of the imaging and analysis methodologies are required for their mainstream adoption.
The focus of the BWH QIN effort is on optimization of the methods and software for pharmacokinetic (PK) analysis of prostate DCE MRI, and on clinical validation of the developed tools in the context of clinical trials for PCa treatment. This task requires software tools that could enable clinical researchers to perform fusion and coherent visualization of the individual MR parameters, including DCE MRI time series, calculation of the derived metrics at the different stages of treatment and correlation of the various imaging-based features with the histopathological properties of the tissue. Validation of the imaging-based research tools necessitates preparation of organized reference imaging collections, with lesions annotated by the expert radiologists and pathologists.
Development and evaluation of the proposed imaging based tools is distributed between the BWH team (PI Dr. Fiona Fennessy) and a GE Global Research team, led by Dr. Sandeep Gupta. The imaging and clinical expertise of the BWH site is utilized initially to prepare the annotated MRI datasets that enable the GE collaborators to test and refine the DCE MRI PK analysis techniques, with the analysis results communicated to the BWH team using research image formats. 3D Slicer is used as the primary research platform for this project. Its fusion capabilities are used for visualization of individual parameters from the prostate mpMRI datasets, as shown in Fig. 4. Post-processing, registration and plotting functionality of the application can support exploration of the quantitative parameters, arterial input functions, PK model fits and their correlation with the imaging data. The Editor module is used to provide expert radiologists with a convenient interface to contour the suspected lesion site, based on the clinical information and the visual impression, for the subsequent quantitative correlation with the imaging parameters. These tasks are important for the investigation of the various imaging and processing aspects that can influence the PK analysis. The existing image registration capabilities of 3D Slicer and its integration with the Insight Toolkit provide a foundation for the development of the registration tools customized for prostate mpMRI data. The SEM plugin mechanism is often used in implementing such tools, since it supports batch execution for automated analysis of large numbers of datasets. Via its support of open formats for data exchange, 3D Slicer enables coordinated development of both closed-source commercial components by the GE collaborators, and integration of the results derived using those tools within an open research platform.
Figure 4.

Of interest for the broader community, as part of the BWH QIN effort, the capabilities of the Slicer software to handle time-resolved DCE MRI data are being expanded. Specialized Slicer modules customized for the analysis of prostate mpMRI and their correlation with pathology findings are under development. Finally, Slicer markup and annotation infrastructure is being improved in a customized reporting module that will support serialization of the annotations into interoperable formats, such as AIM and DICOM SR. These novel tools will be publicly available as Slicer modules and extensions.
Iowa
Response assessment to cancer therapy based on molecular imaging with PET/CT lacks an accepted robust and accurate quantitative metric. The literature is rife with new and different ways to analyze PET/CT image data, including variants of standardized uptake values (SUV), various lesion-to-background approaches, volume measurement, and metabolic tumor volume, but it is still unclear which of these approaches is best suited for response assessment.
A major goal of the QIN project at the University of Iowa is to establish a publicly accessible and large database of PET/CT images and associated analyses to serve as a test bed for quantitative image analysis in the context of therapy response assessment in head and neck (H&N) cancer. This will allow comparison of different approaches objectively by correlating different metrics with outcomes, and ultimately, lead to optimized quantitative image analysis methods, which will be utilized together with image quality assurance measures to support clinical decision making in several clinical trials.
Slicer was selected as a platform for the integration and development of semi-automatic medical image analysis tools, because it allows focusing on algorithm development while utilizing Slicer included image import/export mechanisms, GUI (viewer), and other general-purpose functions. Equally important, the newly developed image analysis methods and approaches can be easily and directly shared with other researchers within and beyond the QIN network.
Slicer with its developed specialized software extensions (loadable modules) was integrated in a workflow management system, which handles data flow between a research PACS implemented with XNAT16, the Slicer environment itself, and the Iowa QIN database, serving multiple users and different quantitative image analysis tasks. Along the stated paradigm, a Slicer module has been developed to assist in the task of measuring PET imaging based quantitative indices in the tumor region. Although the standard package of 3D Slicer includes a module for PET standardized uptake value (SUV) quantification, the region of interest for quantitative analysis must be specified manually. In contrast, the module developed by the Iowa QIN team allows segmenting tumors or lymph nodes in a highly automated fashion with low user interaction effort. Following the segmentation, a diverse set of 2D and 3D indices of tumor uptake are calculated. For reproducibility purposes, the module allows collecting and storing information (e.g., tumor location, segmentation parameters, visualization settings) utilized by the operator in the process of generating the quantitative indices.
Future work will focus on the development of 4D quantitative analysis approaches as well as method validation on the H&N database. The existing functionality implemented using previous generation of 3D Slicer (version 3) will be transitioned into the most recent release. The implementation of the PET SUV quantification and segmentation approaches will be shared with the QIN community for cross-validation and further improvement of the methodology.
MGH
The goal of the MGH QIN project is to develop quantitative imaging tools to facilitate clinical decision making, particularly in the setting of therapeutic response in glioblastoma multiforme (GBM). The overall research goals are to use mechanistic imaging to understand therapeutic response in GBM and thereby improve care and ultimately survival. Anti-angiogenic agents such as bevacizumab have been approved by the FDA for the treatment of recurrent GBM, and anti-VEGF therapies are used routinely in the clinical care of GBM patients. However, these therapies come with considerable toxicity, and many patients do not respond: the FDA cited a 26% objective response rate. This highlights the critical need for biomarkers of response to therapy in brain tumors. Preliminary data indicate that parametric analysis of multimodal imaging in these tumors provides clinically useful quantitative information to evaluate the response of these therapies. Specifically, DCE MRI, dynamic susceptibility contrast MRI (DSC MRI) and diffusion-weighted imaging provide clinically useful quantitative response information for GBM in the anti-VEGF treatment setting. The different automated and semi-automated segmentation tools within 3D Slicer assist in delineating the different regions of interest (ROIs) based on T1, T2 and FLAIR imaging. These can include enhancing tumor, necrosis and edema as seen in Fig. 6. Patients are imaged at a number of time-points and volumetric analysis based on these regions can be used to assess tumor response (e.g., stable vs progression).
Figure 6.

3D Slicer provides a number of state-of-the-art algorithms for rigid, affine and deformable registration (in addition to manual registration). These algorithms can be selected and optimized depending on the anatomical site (e.g., brain vs prostate), purpose (multimodal vs longitudinal vs registering to an atlas), performance (speed vs accuracy vs robustness), and level of interaction (e.g., use of fiducials or markers). The registration tools within Slicer are utilized in a number of ways. Regions of interest delineated on T1w, T2w or FLAIR MRI are registered to the other imaging modalities and associated parametric maps (e.g., Ktrans maps from DCE, rCBV maps from DSC and ADC maps from DTI) as seen in Fig. 6. This capability helps better understand the distribution of these parameters in the different regions of the tumor and in different patients. These tools can also be used to register the radiation therapy plans (CT-based) to the MR functional imaging, allowing exploration of the site of recurrence with respect to dose field and study the phenomenon of radiation necrosis. Registration algorithms and the change detection tools can be used to identify regions of change in the tumor from longitudinal imaging.
There are a number of enhancements planned for 3D Slicer, both by the Slicer team as well those being developed at the MGH site, that would have tremendous utility for the GBM imaging research. The planned improvements of the 4D support tools and the ability to conduct PK analysis in Slicer will help achieve better-integrated analysis workflows. Currently, external resources are used to create the parametric maps and subsequently import them into Slicer for registration with the anatomical volumes. The recently introduced charting capabilities of Slicer can be used to extend the existing label statistics tools to include histograms and graphs. The MGH investigators are also in the process of developing an EM-based segmentation algorithm to allow automatic delineation of the different regions within the tumor based on the multimodal imaging. The ability to create and store annotations in AIM format will provide an easy, standardized mechanism to exchange our results across the various members of the QIN, and to grade tumors or assess response (e.g., using the McDonald or RANO criteria ).
Ultimately, the vision of the MGH QIN project is to have a fully integrated analytical pipeline whereby each of the use-specific modules are customized for the GBM processing workflow. Specifically, this could lead to a system that (1) queries and retrieves original DICOM images (raw data) from a PACS server, (2) provides automated inter-anatomical registration (e.g., T1-weighted, T2-weighted and FLAIR images) as well as 4D dynamic and functional image registration (e.g., DCE, DSC, DTI, BOLD), (3) automatically segments regions of interest encompassing the abnormalities on anatomical images, (4) launches 4D analysis tools capable of creating parametric maps, and finally (5) extracts metrics and displays relevant characteristics from joint analysis. Importantly, data provenance can be systematically indexed through each process. Such an integrated pipeline will take raw information from clinical imaging to biomarker measurement in an efficient and controlled manner, ultimately facilitating accurate incorporation into a database. Moreover, given Slicer’s tractability, new analytical methods can be readily incorporated into the pipeline, thereby continuously improving our approaches to biomarker development and discovery.
Discussion
We presented three use cases of 3D Slicer that demonstrate how this research platform is currently applied to study cancer in different organs using a variety of imaging modalities by the existing QIN sites. Although the specific research goals of these groups are different, they leverage generic capabilities of Slicer such as processing tools, multi-modal display, image fusion and re-configurable GUI layouts. Common to the use cases is the need to consistently organize and present a variety of imaging data, analysis steps, and results. Augmentations of Slicer by site-specific methods and implemented as Slicer plugins are a key for its usefulness for these groups. The developed plugins can be easily shared among research groups, thus minimizing the need for duplication and facilitating reproducibility and consensus building.
The specifics of the imaging modalities and studied organs create new requirements, motivating the new developments underway and in the planning stages at BWH, Iowa, MGH and collaborating sites. Research in acquisition and analysis of brain images have arguably the longest history compared to the other body organs, resulting in a number of widely used toolkits such as FSL, SPM and FreeSurfer. In contrast, image acquisition protocols optimized for post-processing for other body organs are often still under development, suffering from suboptimal resolution. Robust, community-supported toolkits for post-processing are virtually non-existent for applications outside the brain or for the image analysis of pathology-affected organs. As a result, it will be necessary to investigate and develop new methods and tools. These tools and methods will also require careful validation before being used in the context of the site-specific clinical trials. The use case scenarios presented in this paper are good examples for this process.
There are several unmet needs that are common to all three QIN sites. Support of standardized formats for interoperable exchange of image annotations is critical for the biomarker development and validation. The BWH QIN site is currently augmenting the Slicer annotation and reporting infrastructure. The objective is to provide basic support for the AIM and DICOM SR formats. All of the three sites are involved in the analysis of 4D imaging data, which means by using the common platform they may be able to avoid duplication of the development efforts. Support of DICOM RT standard is currently limited in Slicer, but is needed by several QIN sites, including MGH. In this area the QIN community can benefit from the wider Slicer community, and specifically from the on-going work by the Ontario Consortium for Adaptive Interventions in Radiation Oncology (OCAIRO)17 in improving capabilities of 3D Slicer for radiotherapy applications. As part of this effort, DICOM RT support in Slicer is being improved.
It should be emphasized that the QIN projects described in this manuscript are research projects. 3D Slicer is intended for research use. It is not a medical product and is not approved by the FDA or any other regulatory authority for routine clinical work. The examples and results shown in this paper were obtained by trained investigators following institutional guidelines for safe and ethical biomedical research. The licensing approach adopted by 3D Slicer does not place any constraints on the use of its source code or derivatives; but, of course, any use of the code must comply with laws, regulations, and institutional policies. This is a particularly important consideration for the projects where biomarker development efforts are shared between academic and industry partners, as is the case for the BWH-GE QIN collaboration. Commercial vendors are welcome to extract any needed components from Slicer for use in their products, or they can use Slicer as a reference implementation for testing and comparison of their commercial implementation. Regardless of the approach, there is no obligation to share the source code of their derived system or pay royalties to the Slicer developers. At the same time, it is the sole responsibility of commercial vendors to fully validate any products they offer for clinical use, including any Slicer-derived features they may have incorporated.
In summary, our goal has been to present the capabilities of 3D Slicer as a platform for research and development of new imaging based biomarkers. As we argue in this manuscript, Slicer offers a wide range of features for versatile visualization, exploration and quantitative analysis of imaging data. Collaborative development and validation of image analysis tools is facilitated by Slicer through its use of open and documented formats for communicating various data elements, such as images, coordinate frame transformations produced by registration, segmentation masks and surface models. The platform provides an extensible architecture for customization and development of plugins that are interoperable across various platforms. Various training and support resources are available to the users and developers to ease the learning curve. Naturally, this manuscript can only serve as a brief summary and introduction to 3D Slicer capabilities. The interested reader is encouraged to explore the various resources available from the home page of the 3D Slicer project, http://slicer.org.
Over the years, 3D Slicer has gained broad acceptance in the medical imaging research community. It is a dynamic software that evolves together with the projects that use it in new research applications, often giving back to the community in the form of new contributions to the Slicer. The current capabilities of Slicer have resulted from numerous projects conducted over the last 10 years of Slicer history. The Slicer platform ensured continuity, interoperability, improvement and reproducibility of the earlier accomplishments that are now available as a resource for the QIN community in further advancing the role of imaging as a biomarker of cancer treatment.
Figure 5.

References
- 1.Jemal A, Bray F, Center MM, Ferlay J, Ward E, Forman D. Global cancer statistics. CA: a cancer journal for clinicians. 2011;61(2):69–90. doi: 10.3322/caac.20107. [DOI] [PubMed] [Google Scholar]
- 2.Park JW, Kerbel RS, Kelloff GJ, Barrett JC, Chabner Ba, Parkinson DR, Peck J, Ruddon RW, Sigman CC, Slamon DJ. Rationale for biomarkers and surrogate end points in mechanism-driven oncology drug development. Clinical cancer research: an official journal of the American Association for Cancer Research. 2004 Jun 1;10(11):3885–96. doi: 10.1158/1078-0432.CCR-03-0785. [DOI] [PubMed] [Google Scholar]
- 3.Jeraj R, Cao Y, Ten Haken RK, Hahn C, Marks L. Imaging for assessment of radiation-induced normal tissue effects. International journal of radiation oncology, biology, physics. 2010 Mar 1;76(3 Suppl):S140–4. doi: 10.1016/j.ijrobp.2009.08.077. [DOI] [PMC free article] [PubMed] [Google Scholar]
- 4.Eisenhauer E, Therasse P, Bogaerts J, Schwartz L, Sargent D, Ford R, Dancey J, Arbuck S, Gwyther S, Mooney M, et al. New response evaluation criteria in solid tumours: revised RECIST guideline (version 1.1) European journal of cancer (Oxford, England: 1990) 2009 Jan;45(2):228–247. doi: 10.1016/j.ejca.2008.10.026. [DOI] [PubMed] [Google Scholar]
- 5.Jaffe Ta, Wickersham NW, Sullivan DC. Quantitative imaging in oncology patients: Part 1, radiology practice patterns at major U.S. cancer centers. AJR American journal of roentgenology. 2010 Jul;195(1):101–6. doi: 10.2214/AJR.09.2850. [DOI] [PubMed] [Google Scholar]
- 6.Clarke LP, Croft BS, Nordstrom R, Zhang H, Kelloff G, Tatum J. Quantitative imaging for evaluation of response to cancer therapy. Translational oncology. 2009 Dec;2(4):195–7. doi: 10.1593/tlo.09217. [DOI] [PMC free article] [PubMed] [Google Scholar]
- 7.Gering DT. A System for Surgical Planning and Guidance using Image Fusion and Interventional MR. 1999:106. doi: 10.1002/jmri.1139. [DOI] [PubMed] [Google Scholar]
- 8.Grimson E, Leventon M, Ettinger G, Chabrerie A, Ozlen F, Nakajima S, Atsumi H, Kikinis R, Black P. Clinical experience with a high precision image-guided neurosurgery system. In: Wells WM, Colchester A, Delp S, editors. Proc of MICCAI’98. Vol. 1496. Berlin/Heidelberg: Springer-Verlag; 1998. pp. 63–73. [Google Scholar]
- 9.Gering DT, Nabavi A, Kikinis R, Hata N, O’Donnell LJ, Grimson WE, Jolesz Fa, Black PM, Wells WM. An integrated visualization system for surgical planning and guidance using image fusion and an open MR. Journal of magnetic resonance imaging: JMRI. 2001 Jun;13(6):967–75. doi: 10.1002/jmri.1139. [DOI] [PubMed] [Google Scholar]
- 10.Tempany C, Straus S, Hata N, Haker S. MR-guided prostate interventions. Journal of magnetic resonance imaging: JMRI. 2008 Feb;27(2):356–367. doi: 10.1002/jmri.21259. [DOI] [PMC free article] [PubMed] [Google Scholar]
- 11.Golby AJ, Kindlmann G, Norton I, Yarmarkovich A, Pieper S, Kikinis R. Interactive diffusion tensor tractography visualization for neurosurgical planning. Neurosurgery. 2011 Feb;68(2):496–505. doi: 10.1227/NEU.0b013e3182061ebb. [DOI] [PMC free article] [PubMed] [Google Scholar]
- 12.Caskey CF, Hlawitschka M, Qin S, Mahakian LM, Cardiff RD, Boone JM, Ferrara KW. An Open Environment CT-US Fusion for Tissue Segmentation during Interventional Guidance. PloS one. 2011 Jan;6(11):e27372. doi: 10.1371/journal.pone.0027372. [DOI] [PMC free article] [PubMed] [Google Scholar]
- 13.Frisardi G, Chessa G, Barone S, Paoli A, Razionale A, Frisardi F. Integration of 3D anatomical data obtained by CT imaging and 3D optical scanning for computer aided implant surgery. BMC medical imaging. 2011 Jan;11(1):5. doi: 10.1186/1471-2342-11-5. [DOI] [PMC free article] [PubMed] [Google Scholar]
- 14.Uneri A, Schafer S, Mirota DJ, Nithiananthan S, Otake Y, Taylor RH, Siewerdsen JH. TREK: an integrated system architecture for intraoperative cone-beam CT-guided surgery. International journal of computer assisted radiology and surgery. 2011 Jul 9;7(1):159–173. doi: 10.1007/s11548-011-0636-7. [DOI] [PMC free article] [PubMed] [Google Scholar]
- 15.Reed S. Is there an astronomer in the house? Science (New York, NY) 2011 Feb 11;331(6018):696–7. doi: 10.1126/science.331.6018.696. [DOI] [PubMed] [Google Scholar]
- 16.Fedorov A, Li X, Pohl KM, Bouix S, Styner M, Addicott M, Wyatt C, Daunais JB, Wells WM, Kikinis R. Atlas-guided segmentation of vervet monkey brain MRI. The open neuroimaging journal. 2011 Jan;5:186–97. doi: 10.2174/1874440001105010186. [DOI] [PMC free article] [PubMed] [Google Scholar]
- 17.Yeo CT, Ungi T, U-Thainual P, Lasso A, McGraw RC, Fichtinger G. The effect of augmented reality training on percutaneous needle placement in spinal facet joint injections. IEEE transactions on bio-medical engineering. 2011 Jul;58(7):2031–7. doi: 10.1109/TBME.2011.2132131. [DOI] [PubMed] [Google Scholar]
- 18.Xu H, Gage HD, Santago P. An open source implementation of colon CAD in 3D slicer. In: Proceedings of SPIE. 2010;7624:762421–762421-9. [Google Scholar]
- 19.Washko GR, Hunninghake GM, Fernandez IE, Nishino M, Okajima Y, Yamashiro T, Ross JC, Estépar RSJ, Lynch DA, Brehm JM, et al. Lung volumes and emphysema in smokers with interstitial lung abnormalities. The New England journal of medicine. 2011 Mar 10;364(10):897–906. doi: 10.1056/NEJMoa1007285. [DOI] [PMC free article] [PubMed] [Google Scholar]
- 20.Chen DQ, Quan J, Guha A, Tymianski M, Mikulis D, Hodaie M. Three-dimensional in vivo modeling of vestibular schwannomas and surrounding cranial nerves with diffusion imaging tractography. Neurosurgery. 2011 Apr;68(4):1077–83. doi: 10.1227/NEU.0b013e31820c6cbe. [DOI] [PubMed] [Google Scholar]
- 21.Vatta F, Di Salle F. Brain morphometry in autism spectrum disorders: a unified approach for structure-specific statistical analysis of neuroimaging data – biomed 2011. Biomedical sciences instrumentation. 2011 Jan;47:135–41. [PubMed] [Google Scholar]
- 22.Ashburner J. Computational anatomy with the SPM software. Magnetic resonance imaging. 2009 Oct;27(8):1163–74. doi: 10.1016/j.mri.2009.01.006. [DOI] [PubMed] [Google Scholar]
- 23.Yushkevich Pa, Piven J, Hazlett HC, Smith RG, Ho S, Gee JC, Gerig G. User-guided 3D active contour segmentation of anatomical structures: significantly improved efficiency and reliability. NeuroImage. 2006 Jul 1;31(3):1116–28. doi: 10.1016/j.neuroimage.2006.01.015. [DOI] [PubMed] [Google Scholar]
- 24.Jiang H, van Zijl PCM, Kim J, Pearlson GD, Mori S. DtiStudio: resource program for diffusion tensor computation and fiber bundle tracking. Computer methods and programs in biomedicine. 2006 Feb;81(2):106–16. doi: 10.1016/j.cmpb.2005.08.004. [DOI] [PubMed] [Google Scholar]
- 25.Smith SM, Jenkinson M, Woolrich MW, Beckmann CF, Behrens TEJ, Johansen-Berg H, Bannister PR, De Luca M, Drobnjak I, Flitney DE, et al. Advances in functional and structural MR image analysis and implementation as FSL. NeuroImage. 2004 Jan;23(Suppl 1):S208–19. doi: 10.1016/j.neuroimage.2004.07.051. [DOI] [PubMed] [Google Scholar]
- 26.Rosset A, Spadola L, Ratib O. OsiriX: an open-source software for navigating in multidimensional DICOM images. Journal of digital imaging: the official journal of the Society for Computer Applications in Radiology. 2004 Sep;17(3):205–16. doi: 10.1007/s10278-004-1014-6. [DOI] [PMC free article] [PubMed] [Google Scholar]
- 27.McAuliffe MJ, Lalonde FM, McGarry D, Gandler W, Csaky K, Trus BL. Medical Image Processing, Analysis and Visualization in clinical research. In: Proceedings 14th IEEE Symposium on Computer-Based Medical Systems CBMS 2001 IEEE Comput Soc. 2001:381–386. [Google Scholar]
- 28.Barboriak DP, Padua AO, York GE, Macfall JR. Creation of DICOM–aware applications using ImageJ. Journal of digital imaging: the official journal of the Society for Computer Applications in Radiology. 2005 Jun;18(2):91–9. doi: 10.1007/s10278-004-1879-4. [DOI] [PMC free article] [PubMed] [Google Scholar]
- 29.Liao W, Deserno TM, Spitzer K. Evaluation of free non-diagnostic DICOM software tools. Proceedings of SPIE; SPIE; 2008. pp. 691903–691903-12. [Google Scholar]
- 30.Walter T, Shattuck DW, Baldock R, Bastin ME, Carpenter AE, Duce S, Ellenberg J, Fraser A, Hamilton N, Pieper S, et al. Visualization of image data from cells to organisms. Nature methods. 2010 Mar;7(3 Suppl):S26–41. doi: 10.1038/nmeth.1431. [DOI] [PMC free article] [PubMed] [Google Scholar]
- 31.Rubin DL, Mongkolwat P, Kleper V, Supekar K, Channin DS. Annotation and Image Markup: Accessing and Interoperating with the Semantic Content in Medical Imaging. IEEE Intelligent Systems. 2009 Jan;24(1):57–65. [Google Scholar]
- 32.Channin DS, Mongkolwat P, Kleper V, Sepukar K, Rubin DL. The caBIG annotation and image Markup project. Journal of digital imaging: the official journal of the Society for Computer Applications in Radiology. 2010 Apr;23(2):217–25. doi: 10.1007/s10278-009-9193-9. [DOI] [PMC free article] [PubMed] [Google Scholar]
- 33.Pieper S, Halle M, Kikinis R. 3D Slicer. Proc of the 1st IEEE International Symposium on Biomedical Imaging: From Nano to Macro 2004. 2004:632–635. [Google Scholar]
- 34.Mildenberger P, Eichelberg M, Martin E. Introduction to the DICOM standard. European radiology. 2002 Apr;12(4):920–7. doi: 10.1007/s003300101100. [DOI] [PubMed] [Google Scholar]
- 35.Pieper S, Lorensen B, Schroeder W, Kikinis R. The NA-MIC Kit: ITK, VTK, Pipelines, Grids and 3D Slicer as An Open Platform for the Medical Image Computing Community. 3rd IEEE International Symposium on Biomedical Imaging: Macro to Nano; 2006; IEEE. 2006. pp. 698–701. [Google Scholar]
- 36.Ibanez L, Schroeder W. The ITK Software Guide 2.4. Kitware, Inc; 2005. p. 804. [Google Scholar]
- 37.Estépar RSJ, Stylopoulos N, Ellis R, Samset E, Westin C-F, Thompson C, Vosburgh K. Towards scarless surgery: an endoscopic ultrasound navigation system for transgastric access procedures. Computer aided surgery: official journal of the International Society for Computer Aided Surgery. 2007 Nov;12(6):311–24. doi: 10.3109/10929080701746892. [DOI] [PubMed] [Google Scholar]
- 38.Perona P, Malik J. Scale-space and edge detection using anisotropic diffusion. IEEE Transactions on Pattern Analysis and Machine Intelligence. 1990 Jul;12(7):629–639. [Google Scholar]
- 39.Tustison NJ, Avants BB, Cook PA, Zheng Y, Egan A, Yushkevich PA, Gee JC. N4ITK: Improved N3 Bias Correction. IEEE transactions on medical imaging. 2010 Apr;29(6):1310–1320. doi: 10.1109/TMI.2010.2046908. [DOI] [PMC free article] [PubMed] [Google Scholar]
- 40.Horn BKP, Hilden HM, Negahdaripour S. Closed-Form Solution of Absolute Orientation using Orthonormal Matrices. JOURNAL OF THE OPTICAL SOCIETY AMERICA. 1988;5(7):1127–1135. [Google Scholar]
- 41.Wells WM, III, Viola P, Atsumi H, Nakajima S, Kikinis R. Multi-modal volume registration by maximization of mutual information. Medical Image Analysis. 1996 Mar;1(1):35–51. doi: 10.1016/s1361-8415(01)80004-9. [DOI] [PubMed] [Google Scholar]
- 42.Mattes D, Haynor DR, Vesselle H, Lewellen TK, Eubank W. PET-CT image registration in the chest using free-form deformations. IEEE transactions on medical imaging. 2003 Jan;22(1):120–8. doi: 10.1109/TMI.2003.809072. [DOI] [PubMed] [Google Scholar]
- 43.Karasev P, Malcolm J, Niethammer M, Kikinis R, Tannenbaum A. User-driven 3D mesh region targeting. Imaging. 2010;7625:762513–762513-8. [Google Scholar]
- 44.Pichon E, Tannenbaum A, Kikinis R. A statistically based flow for image segmentation. Medical image analysis. 2004 Sep;8(3):267–74. doi: 10.1016/j.media.2004.06.006. [DOI] [PMC free article] [PubMed] [Google Scholar]
- 45.Gao Y, Tannenbaum A, Kikinis R. In: Medical Computer Vision. Recognition Techniques and Applications in Medical Imaging. Menze B, Langs G, Tu Z, Criminisi A, editors. Berlin, Heidelberg: Springer Berlin Heidelberg; 2011. pp. 195–203. [Google Scholar]
- 46.Veeraraghavan H, Miller JV. Active learning guided interactions for consistent image segmentation with reduced user interactions. 2011 IEEE International Symposium on Biomedical Imaging: From Nano to Macro; IEEE. 2011. pp. 1645–1648. [DOI] [PMC free article] [PubMed] [Google Scholar]
- 47.Wells WM, Grimson WL, Kikinis R, Jolesz FA. Adaptive segmentation of MRI data. IEEE transactions on medical imaging. 1996 Jan;15(4):429–42. doi: 10.1109/42.511747. [DOI] [PubMed] [Google Scholar]
- 48.Pohl KM, Bouix S, Nakamura M, Rohlfing T, McCarley RW, Kikinis R, Grimson WEL, Shenton ME, Wells WM. A hierarchical algorithm for MR brain image parcellation. IEEE transactions on medical imaging. 2007 Sep;26(9):1201–12. doi: 10.1109/TMI.2007.901433. [DOI] [PMC free article] [PubMed] [Google Scholar]
- 49.Basser PJ, Pajevic S, Pierpaoli C, Duda J, Aldroubi A. In vivo fiber tractography using DT-MRI data. Magnetic Resonance in Medicine. 2000;44(4):625–632. doi: 10.1002/1522-2594(200010)44:4<625::aid-mrm17>3.0.co;2-o. [DOI] [PubMed] [Google Scholar]
- 50.Tokuda J, Fischer GS, Papademetris X, Yaniv Z, Ibanez L, Cheng P, Liu H, Blevins J, Arata J, Golby AJ, et al. OpenIGTLink: an open network protocol for image-guided therapy environment. The international journal of medical robotics computer assisted surgery MRCAS. 2009;5(4):423–434. doi: 10.1002/rcs.274. [DOI] [PMC free article] [PubMed] [Google Scholar]
- 51.Oliphant TE. Python for Scientific Computing. Computing in Science & Engineering. 2007 May 1;9(3):10–20. [Google Scholar]
- 52.Eads D, Rosten E. Experiences Using SciPy for Computer Vision Research. Proceedings of the 7th Python in Science Conference; 2008. pp. 22–26. [Google Scholar]
- 53.Pierson R, Johnson H, Harris G, Keefe H, Paulsen JS, Andreasen NC, Magnotta VA. Fully automated analysis using BRAINS: AutoWorkup. NeuroImage. 2011 Jan 1;54(1):328–36. doi: 10.1016/j.neuroimage.2010.06.047. [DOI] [PMC free article] [PubMed] [Google Scholar]
- 54.Gorgolewski K, Burns CD, Madison C, Clark D, Halchenko YO, Waskom ML, Ghosh SS. Nipype: A Flexible, Lightweight and Extensible Neuroimaging Data Processing Framework in Python. Frontiers in neuroinformatics. 2011 Aug;5:15. doi: 10.3389/fninf.2011.00013. [DOI] [PMC free article] [PubMed] [Google Scholar]
- 55.Turkbey B, Pinto PA, Mani H, Bernardo M, Pang Y, McKinney YL, Khurana K, Ravizzini GC, Albert PS, Merino MJ, et al. Prostate cancer: value of multiparametric MR imaging at 3 T for detection–histopathologic correlation. Radiology. 2010 Apr;255(1):89–99. doi: 10.1148/radiol.09090475. [DOI] [PMC free article] [PubMed] [Google Scholar]
- 56.Hoeks CMA, Barentsz JO, Hambrock T, Yakar D, Somford DM, Heijmink SWTPJ, Scheenen TWJ, Vos PC, Huisman H, van Oort IM, et al. Prostate Cancer: Multiparametric MR Imaging for Detection, Localization, and Staging. Radiology. 2011 Oct;261(1):46–66. doi: 10.1148/radiol.11091822. [DOI] [PubMed] [Google Scholar]
- 57.Fennessy F, Gupta SN, Fedorov A, Mulkern R, Tang Y, Franco F, Tuncali K, Schmidt E, Tempany C. A comparison between arterial input function approaches for high temporal resolution pharmacokinetic analysis of prostate cancer at 3.0T. ISMRM. 2011;17:3064. [Google Scholar]
- 58.Fennessy F, Fedorov A, Gupta SN, Wells W, Mulkern RV, Tempany CM. Assessment of abnormal ADC matched voxels with DCE parameters for characterization of prostate cancer at 3T. ISMRM. 2012;2 [Google Scholar]
- 59.Fedorov A, Tuncali K, Fennessy F, Tokuda J, Hata N, Wells S, Kikinis R, Tempany C. Hierarchical Image Registration for Improved Sampling during 3T MRI-guided Transperineal Targeted Prostate Biopsy. In: ISMRM. 2011;29:3055. [Google Scholar]
- 60.Fedorov A, Ibanez L, Tuncali K, Mulkern RV, Wells WM, Tempany C, Fennessy F. Deformable Registration for Recovering Image Distortions in DWI MRI of the Prostate at 3T. In: ISMRM. 2012;256 [Google Scholar]
- 61.Clunie DA. DICOM Structured Reporting and Cancer Clinical Trials Results. Cancer Informatics. 2007;4:33–56. doi: 10.4137/cin.s37032. [DOI] [PMC free article] [PubMed] [Google Scholar]
- 62.Wahl RL, Jacene H, Kasamon Y, Lodge MA. From RECIST to PERCIST: Evolving Considerations for PET response criteria in solid tumors. Journal of nuclear medicine: official publication, Society of Nuclear Medicine. 2009 May;50( Suppl 1):122S–50S. doi: 10.2967/jnumed.108.057307. [DOI] [PMC free article] [PubMed] [Google Scholar]
- 63.Boellaard R. Standards for PET image acquisition and quantitative data analysis. Journal of nuclear medicine: official publication, Society of Nuclear Medicine. 2009 May;50(Suppl 1):11S–20S. doi: 10.2967/jnumed.108.057182. [DOI] [PubMed] [Google Scholar]
- 64.Tomasi G, Turkheimer F, Aboagye E. Importance of Quantification for the Analysis of PET Data in Oncology: Review of Current Methods and Trends for the Future. Molecular imaging and biology: MIB: the official publication of the Academy of Molecular Imaging. 2011 Aug 13;:1–16. doi: 10.1007/s11307-011-0514-2. [DOI] [PubMed] [Google Scholar]
- 65.Scott BJ, Quant EC, McNamara MB, Ryg PA, Batchelor TT, Wen PY. Bevacizumab salvage therapy following progression in high-grade glioma patients treated with VEGF receptor tyrosine kinase inhibitors. Neuro-oncology. 2010 Jun 1;12(6):603–7. doi: 10.1093/neuonc/nop073. [DOI] [PMC free article] [PubMed] [Google Scholar]
- 66.FDA. Oncologic Drugs Advisory Committee – Briefing Information for the March 31, 2009 Meeting of the Oncologic Drugs Advisory Committee; Center for Drug Evaluation and Research; 2009. [Google Scholar]
- 67.Sorensen AG, Batchelor TT, Zhang W-T, Chen P-J, Yeo P, Wang M, Jennings D, Wen PY, Lahdenranta J, Ancukiewicz M, et al. A “vascular normalization index” as potential mechanistic biomarker to predict survival after a single dose of cediranib in recurrent glioblastoma patients. Cancer research. 2009 Jul 1;69(13):5296–300. doi: 10.1158/0008-5472.CAN-09-0814. [DOI] [PMC free article] [PubMed] [Google Scholar]
- 68.Macdonald D, Cascino T, Schold S, Cairncross J. Response criteria for phase II studies of supratentorial malignant glioma. J Clin Oncol. 1990;8(7):1277–1280. doi: 10.1200/JCO.1990.8.7.1277. [DOI] [PubMed] [Google Scholar]
- 69.Wen PY, Macdonald DR, Reardon DA, Cloughesy TF, Sorensen AG, Galanis E, Degroot J, Wick W, Gilbert MR, Lassman AB, et al. Updated response assessment criteria for high-grade gliomas: response assessment in neuro-oncology working group. Journal of clinical oncology: official journal of the American Society of Clinical Oncology. 2010 May;28(11):1963–72. doi: 10.1200/JCO.2009.26.3541. [DOI] [PubMed] [Google Scholar]
Looking for a Similar Assignment? Order now and Get 10% Discount! Use Coupon Code "Newclient"


